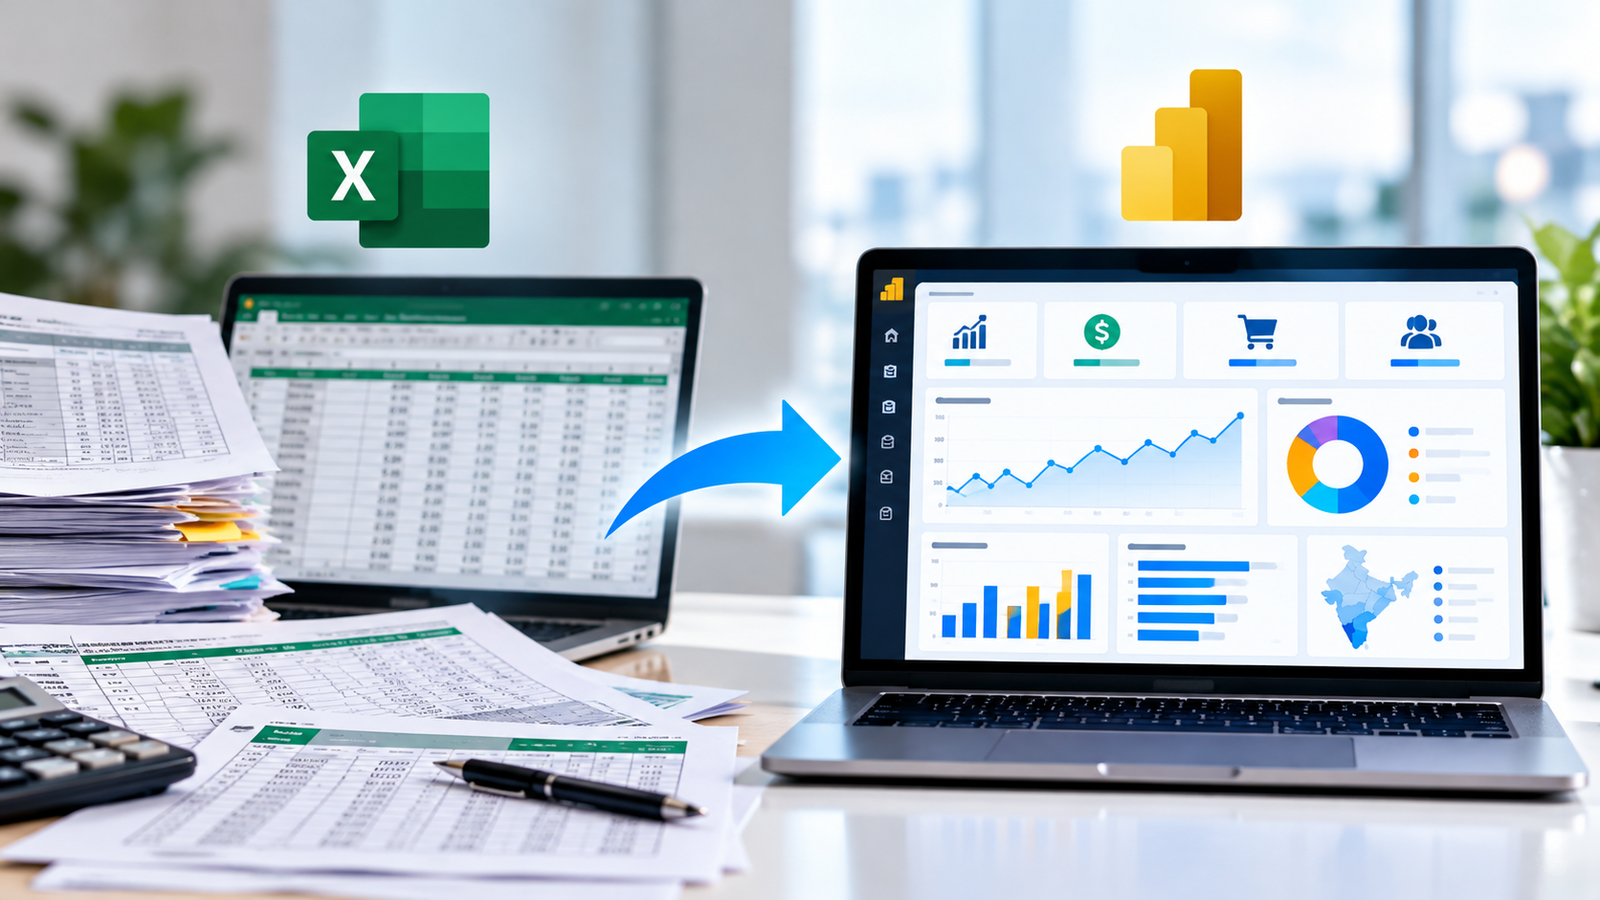
Excel vs Power BI: Which Is Better for Business Reporting?
Microsoft Excel is one of the most widely used tools for business reporting. Companies use it to calculate sales, track expenses, maintain inventory records, and prepare monthly reports.
However, as a business grows, its reporting requirements may become more complex. Data may be spread across multiple spreadsheets, reports may require repeated manual updates, and managers may find it difficult to understand overall business performance.
This is where Microsoft Power BI can help.
Excel and Power BI are both useful business tools, but they serve different purposes. Understanding their strengths can help you choose the right approach for your reporting needs.
What Is Excel?
Microsoft Excel is a spreadsheet application used for calculations, data entry, analysis, charts, and reporting.
Businesses commonly use Excel for:
- Sales and expense calculations
- Budget preparation
- Inventory tracking
- Data cleaning and analysis
- Financial statements and summaries
- Small and medium-sized reports
Excel is flexible and familiar to many employees. It is particularly useful when working with individual datasets, performing calculations, and making quick changes to information.
For many business tasks, Excel remains an excellent choice.
What Is Power BI?
Microsoft Power BI is a business intelligence platform used to connect data sources, model information, and create interactive reports and dashboards.
Businesses can use Power BI to:
- Combine data from multiple sources
- Build interactive sales dashboards
- Monitor business KPIs
- Analyse revenue and profitability
- Explore trends using filters and drill-downs
- Share reports with authorized users
- Configure data refreshes where supported
Power BI is particularly useful when decision-makers need a consolidated view of business performance rather than several separate reports.
Excel vs Power BI: Key Differences
1. Data Analysis
Excel: Excellent for spreadsheet calculations, ad hoc analysis, formulas, and detailed data manipulation.
Power BI: Useful for analysing related datasets, creating reusable measures, and exploring business performance through interactive reports.
2. Data Visualization
Excel: Supports charts, pivot tables, conditional formatting, and dashboards.
Power BI: Provides interactive visual reports with slicers, cross-filtering, drill-downs, and multiple report pages.
Both tools can visualize data effectively. Power BI is often more convenient when users need to explore several connected business metrics.
3. Reporting Automation
Excel: Reporting can be automated using features such as Power Query, formulas, VBA, and Office Scripts, depending on the environment.
Power BI: Reports can use configured data connections and refresh schedules, subject to source-system access, licensing, and technical requirements.
Neither tool eliminates manual work automatically. The reporting process must be designed and configured appropriately.
4. Combining Data from Multiple Sources
Excel: Can import and combine data from spreadsheets, databases, and other sources using features such as Power Query.
Power BI: Can connect to multiple supported data sources and create a model that relates information for reporting.
Power BI can be especially useful when business information comes from sales systems, finance software, databases, and spreadsheets.
5. Interactive Business Dashboards
Excel: Supports dashboards using charts, pivot tables, slicers, and other spreadsheet features.
Power BI: Is designed for interactive business reporting, making it easier to navigate between metrics and investigate performance changes.
For example, a manager can select a product category or region and explore how it affects sales, profit, and other connected metrics.
6. Sharing and Collaboration
Excel: Files can be shared through email or collaboration platforms, with appropriate permissions and version management.
Power BI: Reports can be published and shared through supported Power BI environments, subject to workspace permissions and licensing requirements.
The right option depends on how many people need access and how the organization manages its data.
Comparison Table: Excel vs Power BI
| Feature | Excel | Power BI |
|---|---|---|
| Spreadsheet calculations | Excellent | Supported through data models and measures |
| Ad hoc data analysis | Excellent | Good for model-based analysis |
| Interactive dashboards | Available | Core strength |
| Combining data sources | Supported | Strong data modelling and reporting capabilities |
| Automated refresh | Possible with suitable tools | Supported with suitable configuration |
| Detailed cell-level editing | Excellent | Not its primary purpose |
| Management KPI reporting | Suitable | Particularly useful for interactive reporting |
| Sharing | Files and collaboration tools | Published reports and workspaces, subject to licensing |
Example: A Business Tracking Monthly Sales
Imagine a retail business that records sales in separate Excel files for different branches.
At the end of each month, an employee combines the files, calculates totals, prepares charts, and sends a report to management.
As the number of branches and products grows, this process may become increasingly difficult to maintain.
With a suitable Power BI solution, the business could consolidate the available data and create a dashboard showing:
- Total monthly sales
- Branch-wise performance
- Product category trends
- Sales against targets
- Revenue and profitability indicators, where cost data is available
Managers could then use filters to explore performance by branch, product, or reporting period.
The potential benefit is not simply a better-looking report. It is a more convenient way to access and investigate business information.
Can You Use Excel and Power BI Together?
Yes. In many businesses, using both tools is the most practical approach.
Excel can remain useful for data entry, detailed calculations, working files, and ad hoc analysis. Power BI can use data from Excel and other supported sources to provide consolidated dashboards and interactive reporting.
For example:
- Sales teams maintain their operational records.
- Data is cleaned and prepared using appropriate tools.
- Power BI connects to the required data sources.
- A dashboard presents the agreed business KPIs.
- Authorized managers use the report to monitor performance.
This approach allows businesses to build on their existing processes rather than replacing every spreadsheet.
When Should a Business Consider Power BI?
Power BI may be worth considering when:
- Employees spend significant time combining spreadsheets for recurring reports.
- Management needs a consolidated view of sales, finance, or operations.
- Several departments need to analyse related data.
- Reports need interactive filters and drill-downs.
- The business wants a more structured KPI reporting process.
- Existing reports are difficult to maintain as data grows.
However, if your reporting requirements are simple and Excel already meets your needs, there may be no immediate reason to move to Power BI.
The decision should be based on business requirements, data complexity, cost, security, and available resources.
How Mathimaa.com Can Help
Mathimaa.com provides Business Intelligence and Data Analytics services to help businesses improve reporting and understand their data.
Our services include:
- Power BI dashboard development
- Sales and profitability analysis
- SQL and data transformation
- Reporting automation
- Dashboard performance optimization
- Business KPI reporting
We can discuss your current reporting process, identify the challenges, and explore a solution based on your requirements and available data.
Ready to Improve Your Business Reporting?
If your business relies on multiple spreadsheets or spends too much time preparing recurring reports, let’s discuss whether Power BI or an improved Excel reporting process would be the right fit.
Contact Mathimaa.com
Website: https://www.mathimaa.com
Email: contact@mathimaa.com
WhatsApp: 99943 99390
Mathimaa.com — Turn Your Data into Better Business Decisions.
