Our Portfolio
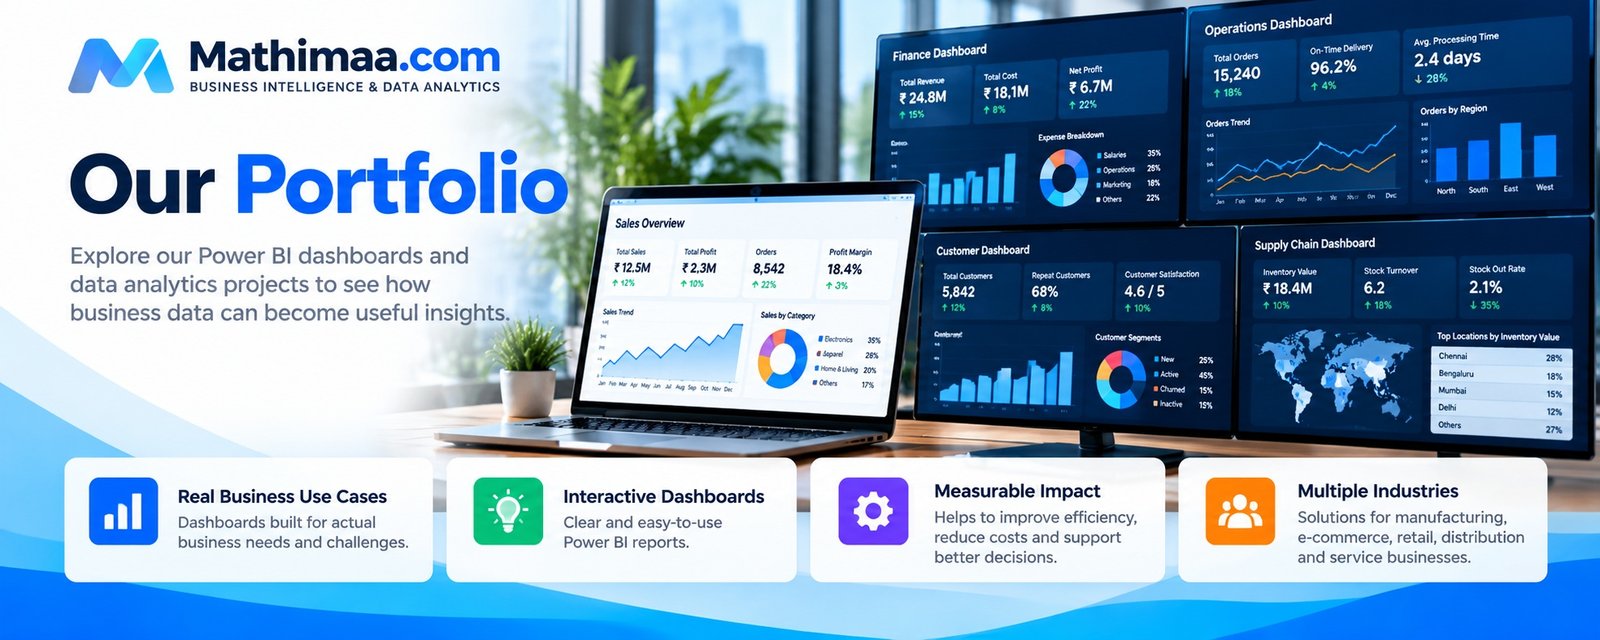
See How Business Data Can Become Useful Insights
Explore sample Business Intelligence dashboards and analytics use cases developed to demonstrate how data can support business reporting and decision-making.
Sample Project 1: Sales & Profitability Dashboard
Business challenge: Sales data can be difficult to analyse across products, regions, and time periods.
Our solution: A Power BI dashboard that consolidates key sales and profitability metrics.
Example metrics:
- Total revenue
- Total profit and profit margin
- Monthly sales trends
- Product performance
- Regional sales comparisons
Expected value: A clearer view of sales performance and areas that may require attention.
Sample Project 2: Inventory Analytics Dashboard
Business challenge: Businesses may struggle to identify stock movement and inventory trends.
Our solution: An inventory dashboard that summarizes stock levels and product movement.
Example metrics:
- Current inventory value
- Stock movement trends
- Fast-moving and slow-moving products
- Low-stock indicators
- Product category performance
Expected value: Better visibility into inventory and potential stock management issues.
Sample Project 3: E-commerce Performance Dashboard
Business challenge: Online sales data may be spread across orders, products, returns, and marketing reports.
Our solution: A dashboard that consolidates available e-commerce performance data.
Example metrics:
- Orders and revenue
- Average order value
- Product performance
- Returns and cancellations
- Sales channel comparisons
Expected value: Easier monitoring of e-commerce performance and identification of opportunities for further analysis.
Interested in a Dashboard for Your Business?
We can discuss your existing reports, data sources, and reporting requirements to identify a suitable solution.
Email: contact@mathimaa.com
WhatsApp: 99943 99390