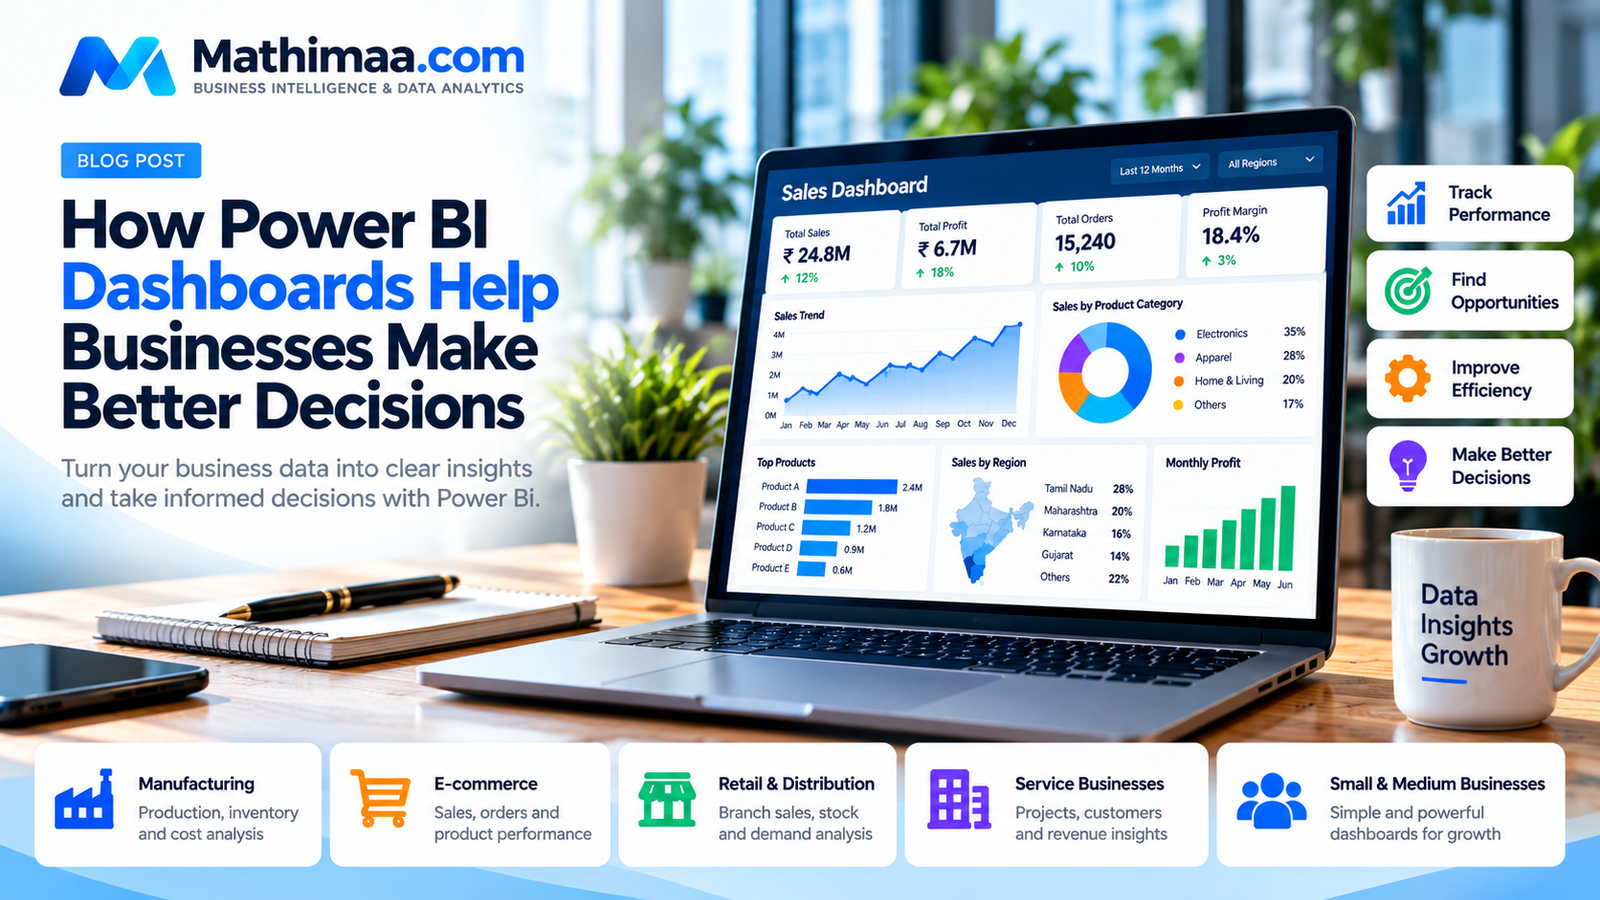
How Power BI Dashboards Help Businesses Make Better Decisions
Every business generates data through sales, purchases, customer transactions, inventory, finance, and daily operations. However, having data does not automatically mean that a business can understand its performance.
Many business owners still depend on Excel spreadsheets, manually prepared reports, and information collected from different software systems. This can make it difficult to identify trends, monitor profitability, and respond quickly to business challenges.
Power BI dashboards help businesses transform raw data into clear visual insights, making it easier to understand performance and make informed decisions.
In this article, we explore how Power BI dashboards work, their key benefits, and how businesses can use them effectively.
What Is a Power BI Dashboard?
Microsoft Power BI is a business intelligence platform that helps organizations analyse data and present it through interactive reports and visualizations.
A Power BI dashboard or report can display important business information, including:
- Total sales and revenue
- Profit and profit margins
- Customer performance
- Product-wise sales
- Inventory levels
- Monthly business trends
- Operational key performance indicators (KPIs)
Instead of reviewing multiple spreadsheets separately, users can explore relevant business metrics in a consolidated reporting experience.
For example, a sales manager can review revenue by month, compare product categories, identify high-performing regions, and investigate changes in performance using interactive filters.
1. Get a Clear View of Sales Performance
Sales performance is one of the most important areas that businesses need to monitor.
Traditional reports may require employees to combine multiple spreadsheets before they can understand sales trends. A Power BI dashboard can bring sales information together in a single report.
Businesses can monitor:
- Daily, weekly, and monthly sales
- Sales by product or category
- Sales by region, branch, or salesperson
- Actual sales compared with targets
- Changes in sales over time
Business benefit: Managers can identify sales trends, compare performance, and investigate areas that may require attention.
2. Understand Profitability, Not Just Revenue
High revenue does not necessarily mean high profit.
A business may generate significant sales but still face profitability challenges because of product costs, discounts, operating expenses, returns, or other factors.
A profitability dashboard can help businesses analyse:
- Total revenue and total costs
- Gross profit and profit margins
- Profitability by product or category
- Regional or branch-level performance
- Monthly changes in costs and profits
The accuracy of these insights depends on the availability and quality of the underlying financial data.
Business benefit: Business owners can better understand which areas contribute to profitability and where further investigation may be needed.
3. Monitor Inventory and Stock Levels
For manufacturing, retail, wholesale, and distribution businesses, inventory management can have a significant impact on operations and working capital.
Power BI can combine available inventory and transaction data to show:
- Current stock levels
- Fast-moving and slow-moving products
- Stock movement over time
- Low-stock indicators
- Inventory value
- Potential excess or obsolete inventory
For example, a retailer may identify products that sell slowly while valuable working capital remains tied up in stock.
Business benefit: Better inventory visibility can support purchasing, replenishment, and stock management decisions.
4. Reduce Manual Reporting Work
Preparing monthly management reports manually can consume valuable employee time.
Employees may need to download data, combine spreadsheets, correct formatting, update calculations, and prepare charts repeatedly.
With a suitable Power BI setup, businesses can create reusable reports and configure data refreshes where the source systems and permissions support them.
This can reduce repetitive reporting tasks and help teams spend more time understanding results.
However, refreshes and automation require appropriate data connections, configuration, licensing, and maintenance.
Business benefit: A more consistent reporting process and potentially less time spent preparing recurring reports.
5. Track Business KPIs in One Place
Key performance indicators (KPIs) help businesses measure progress toward their goals.
Different businesses need different KPIs depending on their industry, size, and objectives.
Examples include:
Sales KPIs
- Revenue growth
- Sales target achievement
- Average order value
- Sales conversion rate, when relevant data is available
Finance KPIs
- Profit margin
- Operating expenses
- Receivables and outstanding payments
- Budget versus actual performance
Operations KPIs
- Production output
- On-time delivery
- Inventory turnover
- Order processing time
A well-designed dashboard helps users monitor these indicators and investigate performance changes.
6. Identify Trends and Opportunities
A dashboard is useful not only for showing current numbers but also for helping users explore patterns in historical data.
Businesses can compare periods, analyse categories, and investigate unusual changes.
For example:
- Which products are generating the most revenue?
- Which branches are below their sales targets?
- During which months do sales usually increase?
- Which inventory categories have slower movement?
- How have operating costs changed over time?
These questions help teams move beyond simply collecting data toward understanding what the data may indicate.
Business decisions should still consider market conditions, operational context, and other relevant information.
7. Support Better and Faster Business Decisions
When business information is scattered across multiple spreadsheets and systems, decision-makers may need to wait for reports before understanding a problem.
A properly designed Power BI reporting solution can make relevant information easier to access and explore.
For example, a management dashboard may bring together revenue, profitability, inventory, and operational indicators so managers can identify issues that require further investigation.
Business benefit: Improved visibility into performance and better-informed discussions about business priorities.
Power BI does not make every decision automatically. Its value comes from presenting reliable information in a format that people can understand and use.
Which Businesses Can Benefit from Power BI Dashboards?
Power BI dashboards can be useful for businesses across different industries.
Manufacturing Companies
Monitor production output, inventory, material usage, rejection rates, costs, and delivery performance when the required data is available.
E-commerce Businesses
Analyse product sales, order trends, returns, customer performance, and sales channels.
Retail and Distribution Businesses
Track branch sales, product movement, stock levels, and customer performance.
Service Businesses
Monitor revenue, expenses, customer activity, project performance, and operational KPIs.
Small and Medium-Sized Businesses
Bring information from spreadsheets and other systems into a more organized reporting environment without relying entirely on manually prepared reports.
The right solution depends on the business’s requirements, available data, budget, and technical environment.
Excel vs Power BI: Do You Need a Dashboard?
Excel remains useful for calculations, ad hoc analysis, smaller reports, and many everyday business tasks.
Power BI may be a better fit when a business needs interactive visual reporting, reusable dashboards, data from multiple sources, or a consolidated view of performance.
Many businesses can use both tools together. Excel can remain part of the workflow while Power BI provides a reporting and visualization layer.
The goal is not to replace every spreadsheet. It is to choose the right tools for the business problem.
How to Get Started with Power BI
If your business is considering Power BI dashboards, begin with these steps.
Step 1: Identify the business problem
Decide what you need to understand—for example, sales performance, profitability, stock movement, or reporting delays.
Step 2: Review your available data
Identify the relevant Excel files, databases, business applications, and other data sources. Check their completeness and consistency.
Step 3: Define your KPIs
Choose the metrics that will help you monitor the business objective.
Step 4: Build a dashboard around business needs
Design reports that make the most important information easy to understand. Avoid adding charts simply for decoration.
Step 5: Validate and maintain the solution
Check calculations against trusted source data, configure appropriate access and refresh settings, and review the dashboard as business requirements change.
How Mathimaa.com Can Help
Mathimaa.com provides Business Intelligence and Data Analytics services designed around business reporting requirements.
Our services include:
- Power BI dashboard development
- Sales and profitability analytics
- SQL and data transformation
- Reporting automation
- Dashboard performance optimization
- Business KPI reporting
We work with clients to understand their reporting challenges, review available data, and discuss suitable solutions based on the agreed project scope.
Whether you want to improve an existing report or develop a new dashboard, the first step is understanding the business problem you want to solve.
Ready to Turn Your Business Data into Better Decisions?
If your business spends too much time preparing reports or struggles to understand sales, profit, inventory, or operational performance, a Power BI dashboard may be worth exploring.
Contact Mathimaa.com to discuss your requirements and arrange an initial consultation.
Website: https://www.mathimaa.com
Email: contact@mathimaa.com
WhatsApp: 99943 99390
Mathimaa.com — Business Intelligence & Data Analytics for Better Business Decisions.
