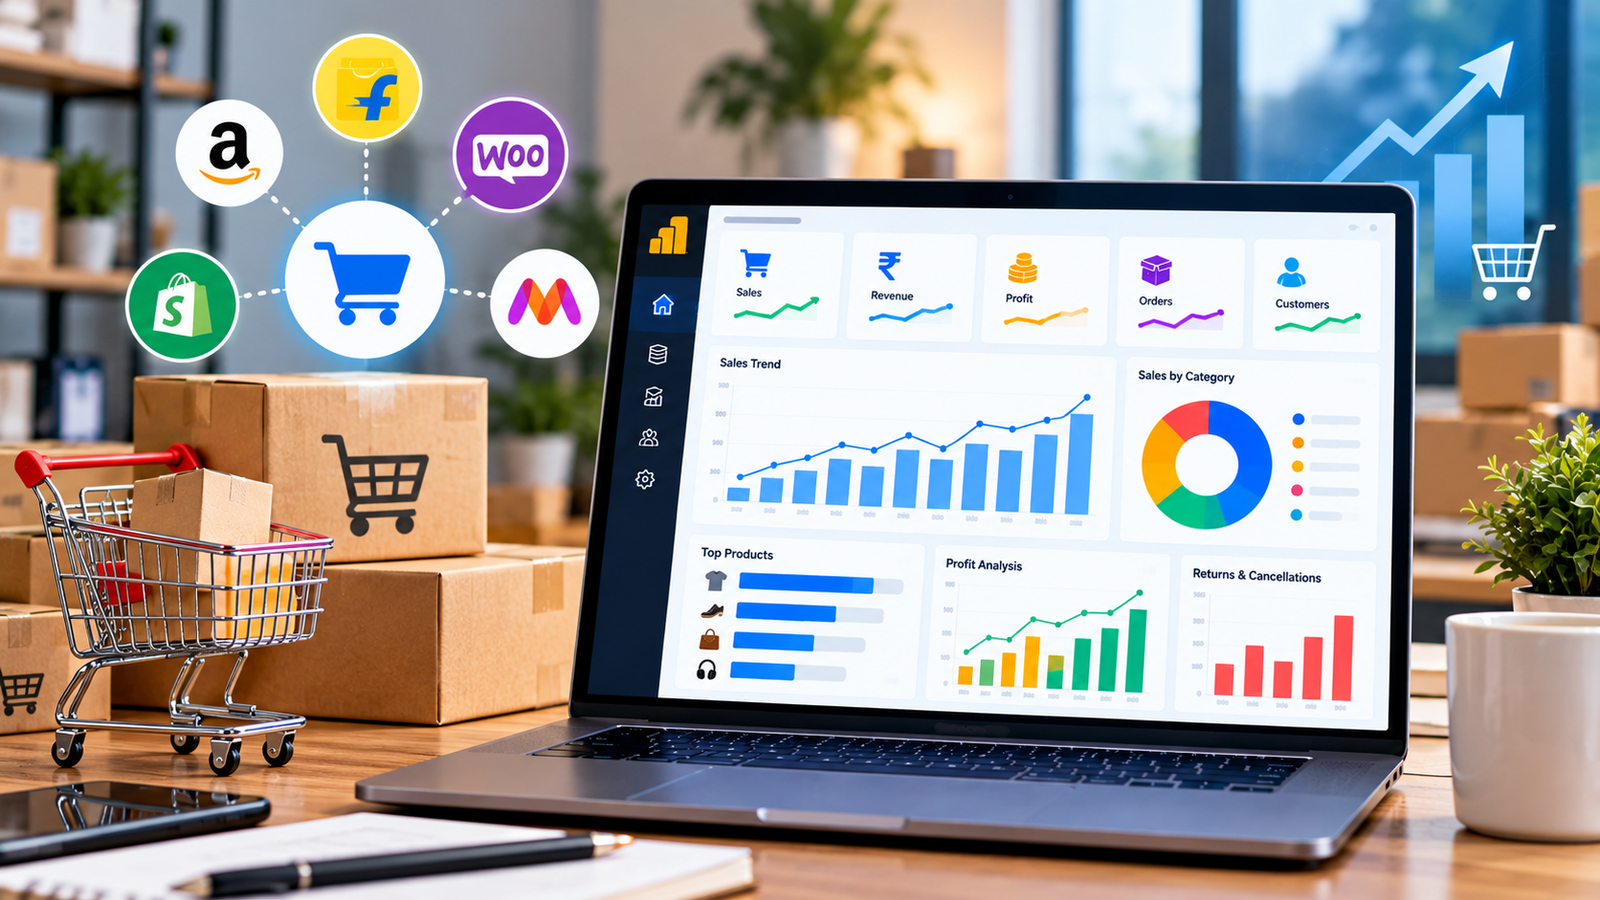
E-commerce Data Analytics: How to Track Sales, Profit and Product Performance
Running an e-commerce business involves more than receiving orders and generating sales. Business owners need to understand which products perform well, how returns affect revenue, how inventory changes over time, and whether sales are generating sufficient profit.
When this information is spread across marketplaces, online stores, advertising platforms, spreadsheets, and inventory systems, it can be difficult to understand overall business performance.
E-commerce data analytics helps businesses turn their sales and operational data into useful insights for better decision-making.
In this article, we explore the key metrics e-commerce businesses should monitor and how Power BI dashboards can help bring important information together.
What Is E-commerce Data Analytics?
E-commerce data analytics is the process of collecting, organizing, and analysing data related to online sales, customers, products, orders, marketing, and inventory.
It helps business owners understand what is happening across their online business and identify areas that may require attention.
Common areas of e-commerce analytics include:
- Sales and revenue analysis
- Product performance
- Customer purchasing behaviour
- Returns and cancellations
- Inventory management
- Marketing performance
- Profitability analysis
The insights available depend on the data collected and the systems used by the business.
1. Track Sales and Revenue Performance
Sales revenue is one of the most important indicators of e-commerce performance. However, looking only at total revenue may not reveal the full picture.
Businesses should also understand how sales change over time and which products, categories, and channels contribute to revenue.
Key metrics to monitor
- Total sales revenue
- Number of orders
- Average order value
- Daily and monthly sales trends
- Revenue by product or category
- Revenue by sales channel
- Sales growth compared with previous periods
How Power BI can help
A Power BI sales dashboard can display important sales metrics using charts, tables, and interactive filters.
For example, a business owner can select a month and examine which products generated the most revenue or compare performance across different sales channels.
Business benefit: Better visibility into sales trends and areas that may offer opportunities for improvement.
2. Identify Your Best- and Worst-Performing Products
Not every product contributes equally to an e-commerce business.
Some products may generate high revenue, while others may sell slowly or produce low margins. Analysing product performance helps businesses understand these differences.
Key metrics to monitor
- Revenue by product
- Units sold
- Orders by product category
- Product growth trends
- Return rates by product
- Profit margin, where cost data is available
- Slow-moving inventory
How Power BI can help
A product performance dashboard can rank products by revenue, quantity sold, or profitability.
For example, a product may generate high sales but have a low profit margin because of discounts, marketplace fees, shipping costs, or product costs.
Combining sales and cost data can help the business evaluate performance more effectively.
Business benefit: More informed decisions about product selection, pricing, promotions, and inventory planning.
3. Understand Profitability, Not Just Sales
High sales do not always translate into high profit.
An e-commerce business may need to account for product costs, shipping expenses, discounts, marketplace commissions, payment fees, advertising costs, returns, and other operating expenses.
Key metrics to monitor
- Gross sales
- Discounts and returns
- Net sales
- Cost of goods sold
- Gross profit and gross margin
- Marketplace and payment fees
- Advertising expenditure
- Contribution margin, where the required cost data is available
How Power BI can help
A profitability dashboard can bring available revenue and cost information together to show how products, categories, or sales channels perform financially.
For example, a product with high revenue may contribute less profit than a lower-volume product with a stronger margin.
The accuracy of profitability analysis depends on using consistent definitions and complete cost information.
Business benefit: A clearer understanding of the financial performance of products and sales channels.
4. Analyse Returns and Order Cancellations
Returns and cancellations can affect revenue, inventory, customer experience, and operating costs.
Monitoring these metrics helps businesses identify products or processes that may require investigation.
Key metrics to monitor
- Total returned orders
- Return rate
- Cancelled orders
- Cancellation rate
- Returns by product
- Return reasons, where recorded
- Refund amounts
- Return trends over time
How Power BI can help
A returns dashboard can show how returns and cancellations vary by product, category, sales channel, or reporting period.
For example, an unusually high return rate for one product may justify reviewing product descriptions, packaging, quality, or customer feedback.
Business benefit: Better visibility into return patterns
